


Commercial Construction Financing in Phoenix: Loan Options
November 18, 2026
The monthly payment is only part of the picture. A Phoenix real estate investment loan calculator helps estimate principal and interest, then account for property taxes, insurance, and other recurring costs that shape the monthly outlay. The result depends on the purchase price, cash down, loan amount, interest rate, and repayment term, so start with realistic inputs.
It’s easy to focus on one payment and overlook the cash needed to close or the total interest over the loan’s life. This guide explains how to estimate monthly loan costs, cash invested, total loan cost, payoff timing, and debt service for a Phoenix investment property. It also shows how rental income and operating expenses affect whether projected income can support the debt. Use the figures to assess the deal, not just to pursue a lower monthly payment.
Key Takeaways
- Estimate the full monthly carrying cost by accounting for property taxes and homeowners insurance alongside principal and interest.
- Use the purchase price, down payment, credit score, ZIP code, loan term, and interest rate to understand what can shift a projected payment.
- Compare total interest and payoff timing, not just the monthly amount, when weighing loan terms or extra payments.
- Calculate net operating income and annual debt service to see how projected property income measures against loan payments.
- Include the down payment and purchase-related costs when estimating how much cash the investment will require upfront.
Property taxes and homeowners insurance
Property tax is the recurring local charge for owning real estate. Homeowners insurance covers specified property losses and liability risks. For a Phoenix rental estimate, enter each as a separate annual expense, then divide by twelve to account for its monthly impact. Use the property’s tax information and an insurance estimate based on its value and coverage, rather than looking at principal and interest alone.
As a broad benchmark, the national median effective property tax rate is 0.89%. Phoenix property taxes depend on the property’s assessed value and applicable tax charges, so a national figure is context, not a property-specific forecast. Treat that as an initial estimate, then account for the property’s characteristics and selected coverage.
A homeowners association fee is a recurring charge for association services and shared-property costs. Include HOA dues as their own monthly expense when the property belongs to an association. A 2025 analysis reported an average monthly homeowners association fee of $291, but that average is not a Phoenix-specific quote. Use the property’s actual association dues in the cash-flow model.
Private mortgage insurance, or PMI, is insurance that may apply to certain mortgages with smaller down payments. For covered mortgages, borrower-paid PMI generally terminates automatically when the scheduled principal balance first reaches 78% of the property’s original value, if the borrower is current and other HPA conditions apply, according to the Consumer Financial Protection Bureau. Don’t treat that point as an immediate reduction in every loan’s payment; coverage and applicable conditions matter.
Conventional loans, DSCR loans, hard-money loans, and portfolio loans differ in how lenders assess the borrower, property, income, and repayment plan. Conventional lending commonly evaluates borrower finances, DSCR lending emphasizes property income relative to debt service, hard money focuses on real-estate collateral, and portfolio terms are retained by the lender.
When estimating a rental purchase, account for potential rent, vacancy, operating expenses, and recurring ownership costs. A calculator may assume annual rent, vacancy, and expenses stay constant, so it won’t automatically reflect changing income or costs. Include repairs, periods without rent, taxes, insurance, HOA dues, and loan payments when testing whether rental income can support ownership.
Investment return with appreciation includes a projected change in property value; return without appreciation relies on income and expenses instead. For example, a property valued at $300,000 and appreciating at 3% annually is estimated to be worth approximately $347,800 after five years. That projection is separate from rental cash flow, and appreciation alone doesn’t pay monthly expenses.
Depreciation is a tax accounting method for allocating a building’s cost over time. According to the Internal Revenue Service, residential rental buildings are generally depreciated over 27.5 years, while nonresidential buildings are generally depreciated over 39 years. Phoenix investors should keep the building classification and rental-use assumptions distinct from property-tax, insurance, and loan-payment estimates.
What Drives the Monthly Payment Beyond Principal and Interest?
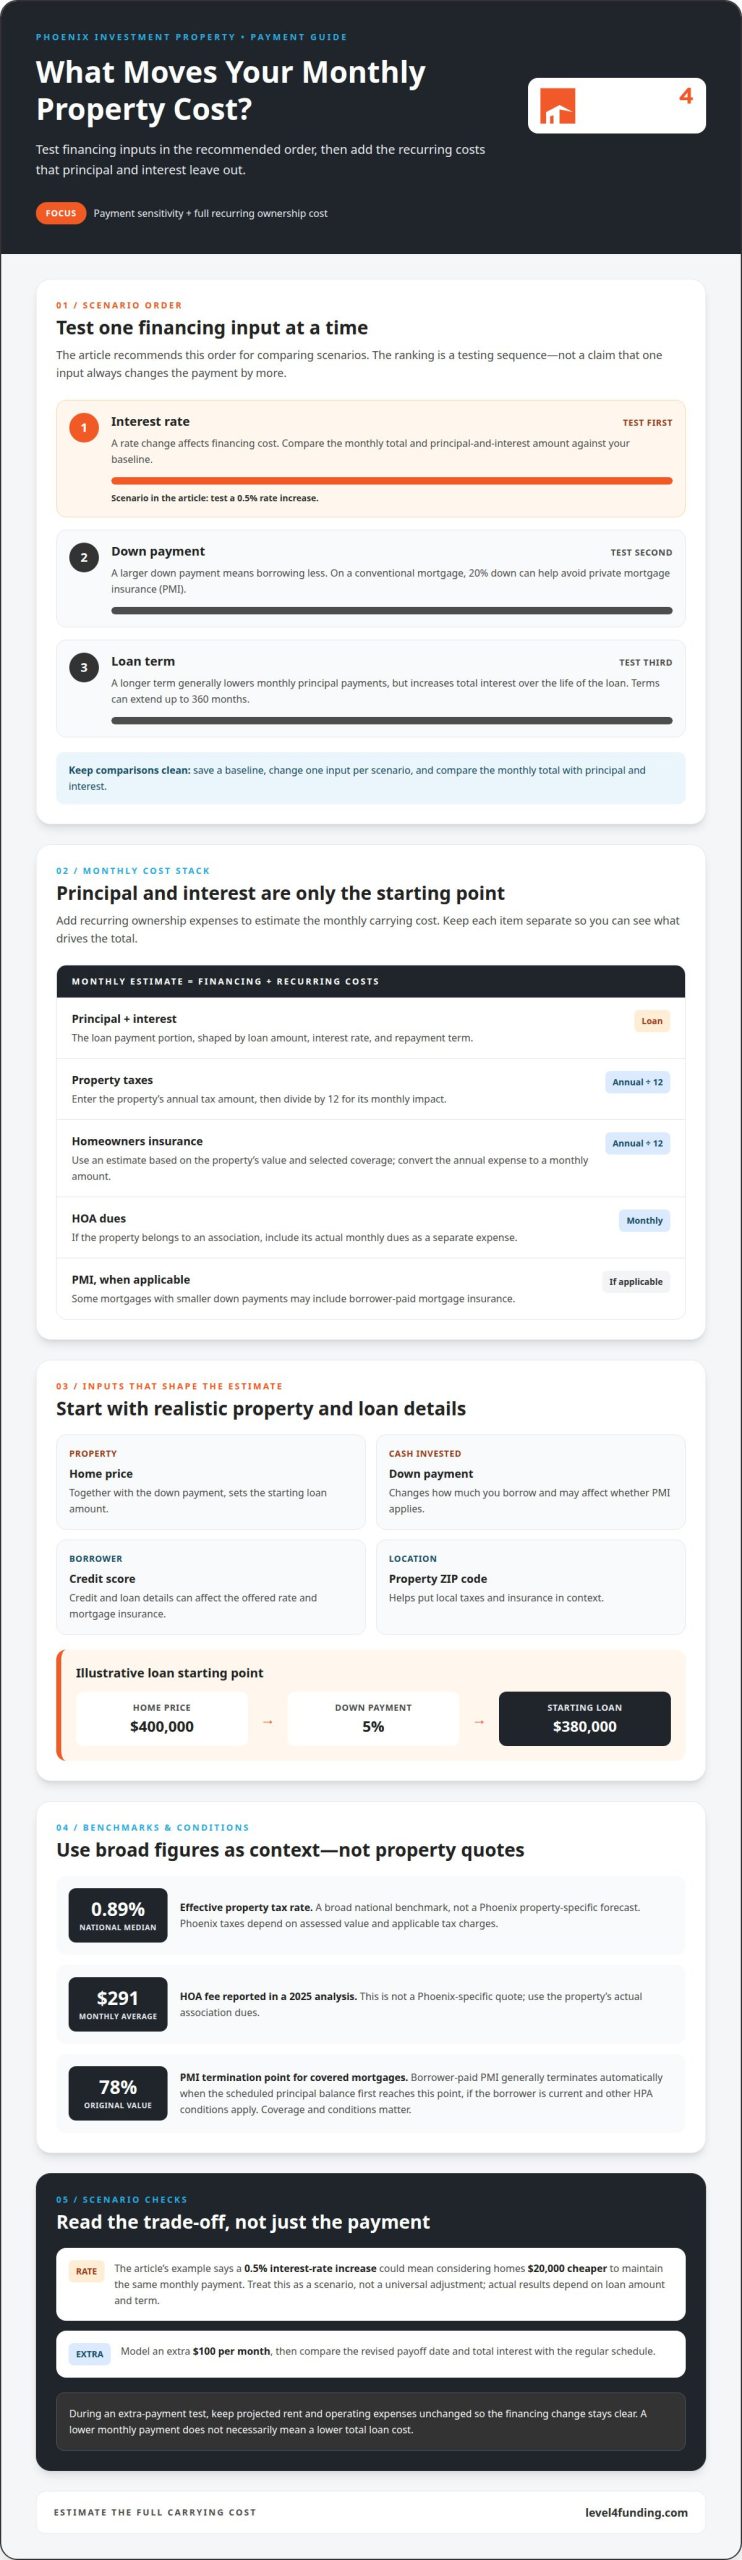
A monthly mortgage payment changes with the loan amount, rate, term, and added ownership costs. Use consistent assumptions, then adjust one input at a time to see how the estimate changes.
Loan and Borrower Inputs
Loan and borrower inputs are the property and financing details used to estimate payments. Enter the home price, down payment, credit score, property ZIP code, loan term, and interest rate. The home price and down payment determine the starting loan amount; credit and loan details can affect the offered rate and mortgage insurance. ZIP code helps place local taxes and insurance in context. Loan terms can extend up to 360 months.
Test a larger down payment to see how borrowing less changes the monthly figure. A 20% down payment can help avoid private mortgage insurance on a conventional mortgage. A longer loan term generally lowers monthly principal payments but increases total interest over the loan’s life. Choose the term based on both monthly cash flow and the overall cost, not the payment alone.
Monthly Payment Breakdown
A monthly payment breakdown separates principal and interest from other recurring costs. For an illustrative conventional loan, a $400,000 home with 5% down starts with a $380,000 loan.
This illustrates why the displayed principal-and-interest figure isn’t the full carrying cost. Keep each amount in its own field or worksheet line. That makes it easier to see which assumption drives the change when you adjust an input.
Rate-change scenarios reveal how sensitive a deal is to financing costs. The calculator’s guidance suggests testing a 0.5% interest-rate increase; its example says that could mean considering homes $20,000 cheaper to maintain the same monthly payment. Treat this as a scenario to test, not a universal price adjustment. The actual payment change depends on the loan amount and term.
Extra-payment scenarios show how paying more can affect payoff timing and interest. Adding $100 per month is one example to model. Compare the regular schedule with the added-payment scenario, then review the revised payoff date and total interest. Keep the property’s projected rent and operating expenses unchanged during this test, so the financing change remains clear.
For a clear comparison, save a baseline estimate, then change only one input per scenario. Test the interest rate first, then the down payment, and finally the term. Compare the monthly total with the principal-and-interest payment. This makes trade-offs visible without confusing a lower payment with a lower total loan cost.
Principal, interest, total loan cost, and payoff date
A loan estimate should show more than the next payment. Track the amount borrowed, interest over time, total repayment, and scheduled payoff date separately.
Loan Principal and Interest
Principal is the amount borrowed; interest is the cost of borrowing it. With a fully amortizing mortgage, each scheduled payment covers both, but their shares change over the loan term.
Early payments generally devote a larger share to interest because the outstanding principal is higher. As principal falls, less interest accrues, and more of each scheduled payment reduces the balance. A 30-year fixed mortgage has 360 payments. Use the loan amount, interest rate, and term together; changing any one changes the payment schedule.
For a second loan, calculate its payment separately using its own balance, rate, and repayment schedule. Add that payment to the first loan’s monthly debt obligation, then consider both balances when estimating total borrowing cost. A combined estimate shows the impact of carrying two payment schedules rather than treating the second loan as part of the original mortgage.
Total Loan Cost and Payoff Date
Total loan cost is the principal repaid plus interest paid over the repayment schedule. The payoff date is when scheduled payments reduce the loan balance to zero.
To compare loan structures, keep the loan amount constant and enter each interest rate and term separately. A longer term generally lowers monthly principal payments but increases total interest over the loan’s lifetime. A shorter term can raise the monthly payment while reducing lifetime interest. Compare both the monthly amount and the full-term total before choosing a schedule that fits the property’s expected cash flow.
Interest-only financing means scheduled payments cover interest without reducing principal during the interest-only period. The payment may look lower during that period, while the loan balance remains outstanding. Model what happens when principal repayment begins, and include the remaining balance in the payoff plan. An estimate for the interest-only period alone won’t show the full cost or final payoff date.
Extra payments can change the timeline when they reduce principal. Compare the original schedule with a scenario that adds an extra amount each month, then review the resulting interest and payoff timing. The research example uses an extra $100 per month to illustrate this effect. Apply the same method to the property’s projected cash flow, keeping assumptions consistent across scenarios.
Mortgage insurance and other recurring ownership expenses affect monthly cash outlay, but they are separate from principal and interest. Keep them visible as distinct line items, then compare scheduled loan repayment with total monthly obligations. This helps clarify whether a lower payment reflects a longer term, an interest-only structure, or costs left out of the estimate.
Net operating income and debt service
Net operating income (NOI) is rental income after operating expenses, before mortgage payments. Debt service is the scheduled loan payments over a stated period. Comparing them shows whether property income can cover its debt.
Rental Income and Vacancy
Effective rental income is potential rent reduced by an allowance for vacancy. In the calculator’s example, $30,000 in potential annual rent less a 5% vacancy allowance produces $28,500 in effective rental income. That adjustment matters: a property can’t collect rent during vacant periods, but loan payments and property taxes continue.
NOI is effective rental income minus operating expenses, excluding mortgage payments. For example, $36,000 in annual rental income less $12,000 in annual operating expenses produces $24,000 in annual NOI. Enter rent and vacancy assumptions separately, then list recurring expenses such as taxes, insurance, and maintenance. The calculator’s projections hold rent, vacancy, and operating expenses constant, so changing those assumptions can materially alter projected income.
Monthly Payments and Investment Metrics
Debt service coverage compares NOI with required loan payments, while cap rate measures NOI against property value. A Phoenix investment property calculator estimates monthly payments from loan inputs, then annualizes them for debt-service analysis. It can compare that obligation with projected rental income after vacancy and operating expenses.
For example, a $1,500 monthly mortgage payment creates $18,000 in annual debt service. Pairing that with $24,000 in annual NOI leaves $6,000 in annual pretax cash flow. A separate example produces a 6% cap rate from $24,000 in annual NOI on a $400,000 property. Cap rate excludes financing, so it helps compare property operations without treating mortgage terms as operating performance.
Cash-on-cash return compares annual pretax cash flow with the cash invested. In the calculator’s example, investing $100,000 and generating $8,000 in annual pretax cash flow produces an 8% annual cash-on-cash return. Keep the investment amount and cash-flow period aligned; otherwise, the percentage won’t represent the same period of performance.
Debt-to-income (DTI) compares monthly debt obligations with gross monthly income. The 28/36 rule advises spending no more than 28% of gross income on housing and no more than 36% on overall debt, including housing. A lender may reject an application if monthly debt obligations exceed 36% to 43% of pretax income. These household-income measures differ from property NOI and debt-service coverage.
For a clear deal snapshot, review NOI, annual debt service, cash flow after debt, cap rate, and cash-on-cash return together. Each answers a different question: operating performance, loan burden, remaining income, property yield, or return on invested cash. No single ratio tells the whole story.
Purchase price and cash invested
Purchase price is the amount paid to acquire a property, before financing and transaction costs. Cash invested is the money committed from the buyer’s funds, including the down payment and purchase-related costs. These figures answer different questions: price sets the acquisition baseline, while cash invested shows how much capital the deal ties up.
Start with the Phoenix property’s purchase price, then enter the planned down payment as a percentage. The loan amount is the purchase price minus that down payment. Eligible conventional mortgages may allow a down payment as low as 3%, but the minimum applicable to an investment property depends on the loan structure. Jumbo mortgages often require a 20% down payment, which can exceed $100,000 at closing.
A down payment changes both the cash needed upfront and the amount borrowed. A larger percentage generally reduces the starting loan balance and can lower the monthly mortgage payment. It also leaves less cash for repairs, vacancy, or other property expenses. Compare scenarios using the same purchase price, then assess monthly obligations and the cash remaining after closing.
Closing costs are purchase-related charges paid in addition to the down payment. U.S. homebuyer closing costs typically run 2% to 5% of the purchase price. Include this estimate in the initial cash calculation rather than treating the down payment as the full amount needed. Actual transaction costs depend on the purchase and loan details.
Build the cash estimate in distinct parts:
- Down payment: the buyer’s percentage of the purchase price applied upfront.
- Closing costs: transaction expenses added to the upfront requirement.
- Property preparation: funds assigned to planned repairs or improvements.
- Operating reserve: cash retained to cover expenses when rental income is interrupted.
Track repair funds and reserves separately from closing costs. This makes it easier to see whether a deal uses nearly all available cash before it begins producing income. Even a purchase with a manageable monthly payment can strain liquidity if too much capital goes toward closing and preparation.
Next, compare cash invested with projected annual income and operating expenses. Cash-on-cash return is pretax cash flow divided by cash invested. If the upfront estimate excludes closing costs or planned work, the calculation overstates performance because the amount of cash invested is understated.
Use a Phoenix purchase estimate to compare price, down payment, closing costs, and retained reserves before deciding how much capital to commit. Explore investment financing with Level 4 Funding when a real estate loan is part of the plan.
Level 4 Funding
Level 4 Funding helps real estate investors connect a financing plan with a property’s purchase, renovation, or income strategy. When your estimate shows a gap between available cash, project costs, and projected income, its real estate loan options can help frame the next financing conversation.
For a property renovation and resale, consider Fix and Flip Loans; for a build project, Construction Loans may fit the project type. Commercial Property Loans address commercial real estate, while Cash Out Refinance can support owners evaluating equity in an existing property. The right direction depends on the asset and investment plan, not simply the monthly payment shown by a calculator.
Bring your purchase assumptions, planned work, and rental or resale strategy into the discussion. Contact Level 4 Funding to talk through your investment financing needs.
Turn Your Estimate Into an Investment Plan
A useful next step is to turn your projected numbers into a plan for the property’s next phase. Use the Phoenix real estate investment loan calculator to test whether your assumptions still work if the rental strategy, renovation scope, or financing structure changes. Then identify which parts of the project need funding and how the property is expected to generate value.
Level 4 Funding offers Fix and Flip Loans, Construction Loans, and Commercial Property Loans for real estate investors. Match the financing conversation to the asset and your intended use, rather than treating a calculator estimate as the whole decision. The clearer your project plan, the more focused that discussion can be.
Ready to discuss your investment financing? Contact Level 4 Funding and take the next step with a clear plan.
Frequently Asked Questions
What down payment, credit score, and debt-to-income requirements apply to Phoenix investment property loans?
Requirements vary by loan program and lender; there’s no universal down payment, credit score, or debt-to-income threshold for every Phoenix investment loan. Eligible conventional mortgages may allow down payments as low as 3%, though investment-property terms vary. Level 4 Funding states that no minimum credit score is required for its hard-money loans; lenders may review judgments, tax liens, or bankruptcy. A lower score may affect the down payment and interest rate.
How do Phoenix property taxes, homeowners insurance, and HOA fees affect an investment loan payment?
Put each charge on the same monthly timeline as the loan. If taxes, insurance, or HOA dues are paid annually or quarterly, convert them into monthly equivalents for cash-flow planning while tracking actual payment dates separately. Then test a scenario with higher expenses or a vacancy period. This helps show whether projected rental income can still cover ownership costs during a slower leasing month.
How do lenders calculate rental income, cash flow, and debt service coverage ratio (DSCR) for Phoenix investment loans?
Start with scheduled rent, reduce it for expected vacancy, then subtract operating expenses to estimate net operating income (NOI). Compare NOI with loan payments: DSCR is NOI divided by debt service. A ratio above 1 means modeled NOI exceeds debt payments; below 1 means it falls short before other owner-level costs. Keep rent and expenses on the same time basis, monthly or annual, for a consistent comparison.
What information is needed to use a Phoenix real estate investment loan calculator?
Enter the purchase price, down payment, interest rate, repayment term, and property ZIP code. Add property taxes, insurance, and HOA costs when available. For rental analysis, include projected rent, vacancy, operating expenses, and cash invested. A Phoenix real estate investment loan calculator can compare a baseline with changed rate, term, or rent assumptions. Change one input at a time to isolate its effect.

About the author
Matt has a bachelor's degree in political science from Northern Arizona University and works at Level 4 Funding, a private lending company that offers hard money and rental home loans to real estate investors in 35 states.
With Matt's leadership, the firm has financed almost $300 million in loans for investment properties. He often helps real estate investors with rental property purchases, foreclosures, refinancing, and fix-and-flip projects. Matt has extensive experience in fix-and-flip, buy-and-hold, rental properties, and real estate sales. He has lived in Arizona for 43 years and is married with three children. Matt is licensed as a mortgage broker and loan originator in Arizona, with NMLS 2062278 and NMLS 1118493.
Equal Housing Opportunity. This is not a Good Faith Estimate, and it is not a Guarantee to lend; it should not be considered as such. Costs, rates, estimates, and terms can only be determined after a full application is completed. To the extent this message includes any tax or legal advice, this message is not intended or written by the sender to be used, and cannot be used, for legal or tax purposes or advice. This is an advertisement. Copyright © 2026. All rights reserved.